Thresholds are part of the workflow
The volcano plot is driven by the selected test and control groups plus the current fold-change and p-value criteria. Significant, upregulated, downregulated, and nonsignificant counts remain visible for review.
Volcano Plots
Master Metabolomics connects volcano plot views with group choices, fold-change thresholds, p-value thresholds, result tables, statistics, and exports in one desktop workflow.
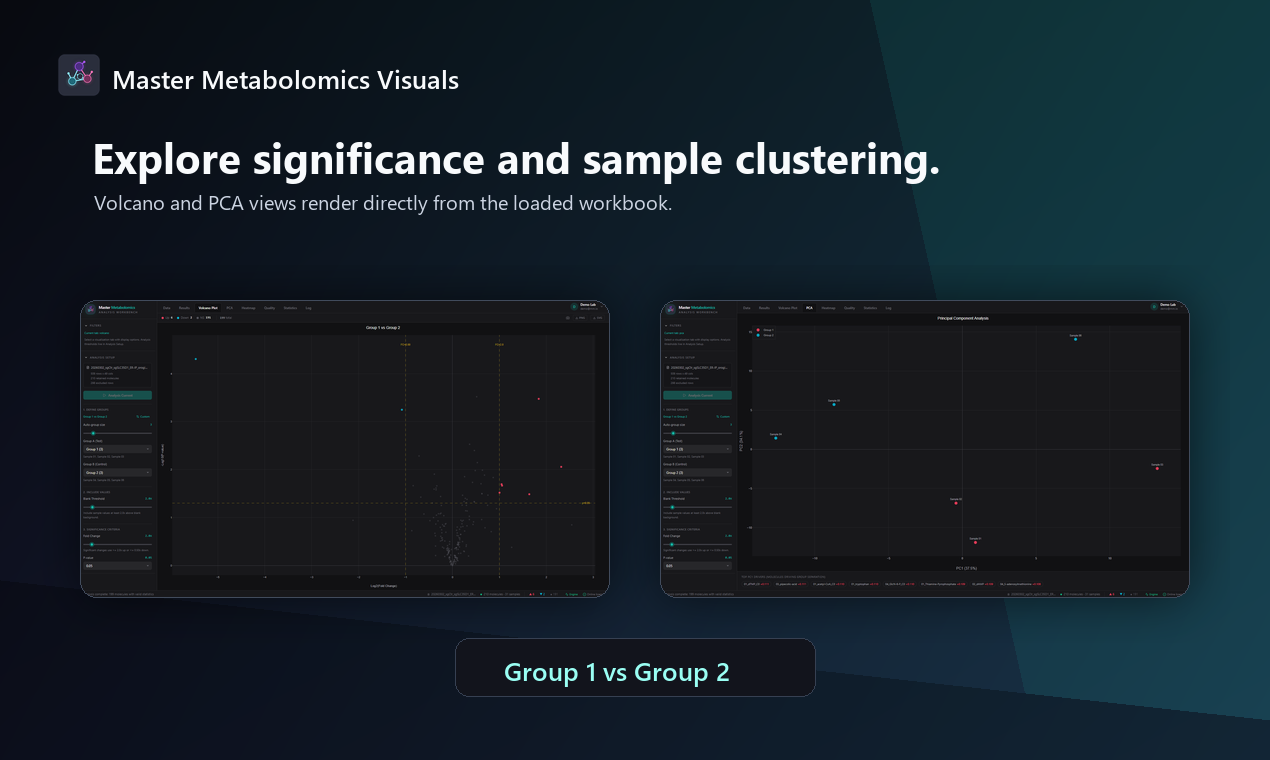
The volcano plot is driven by the selected test and control groups plus the current fold-change and p-value criteria. Significant, upregulated, downregulated, and nonsignificant counts remain visible for review.
Scientists can inspect the high-level distribution in the volcano plot, then review the molecule-level result table and statistics without switching tools.
PCA views complement the volcano plot by showing sample clustering from the same loaded workbook, helping teams review whether group separation matches expectations.
FAQ
Yes. Fold-change and p-value thresholds are part of the analysis setup and are applied through the Run Analysis workflow.
Yes. The visualizations and tables are tied to the same analysis results, groups, and thresholds.
Yes. The desktop app includes a PCA tab for sample clustering context alongside volcano plots, heatmaps, statistics, and result tables.