Windows, macOS, and Linux Analysis stays on the desktop
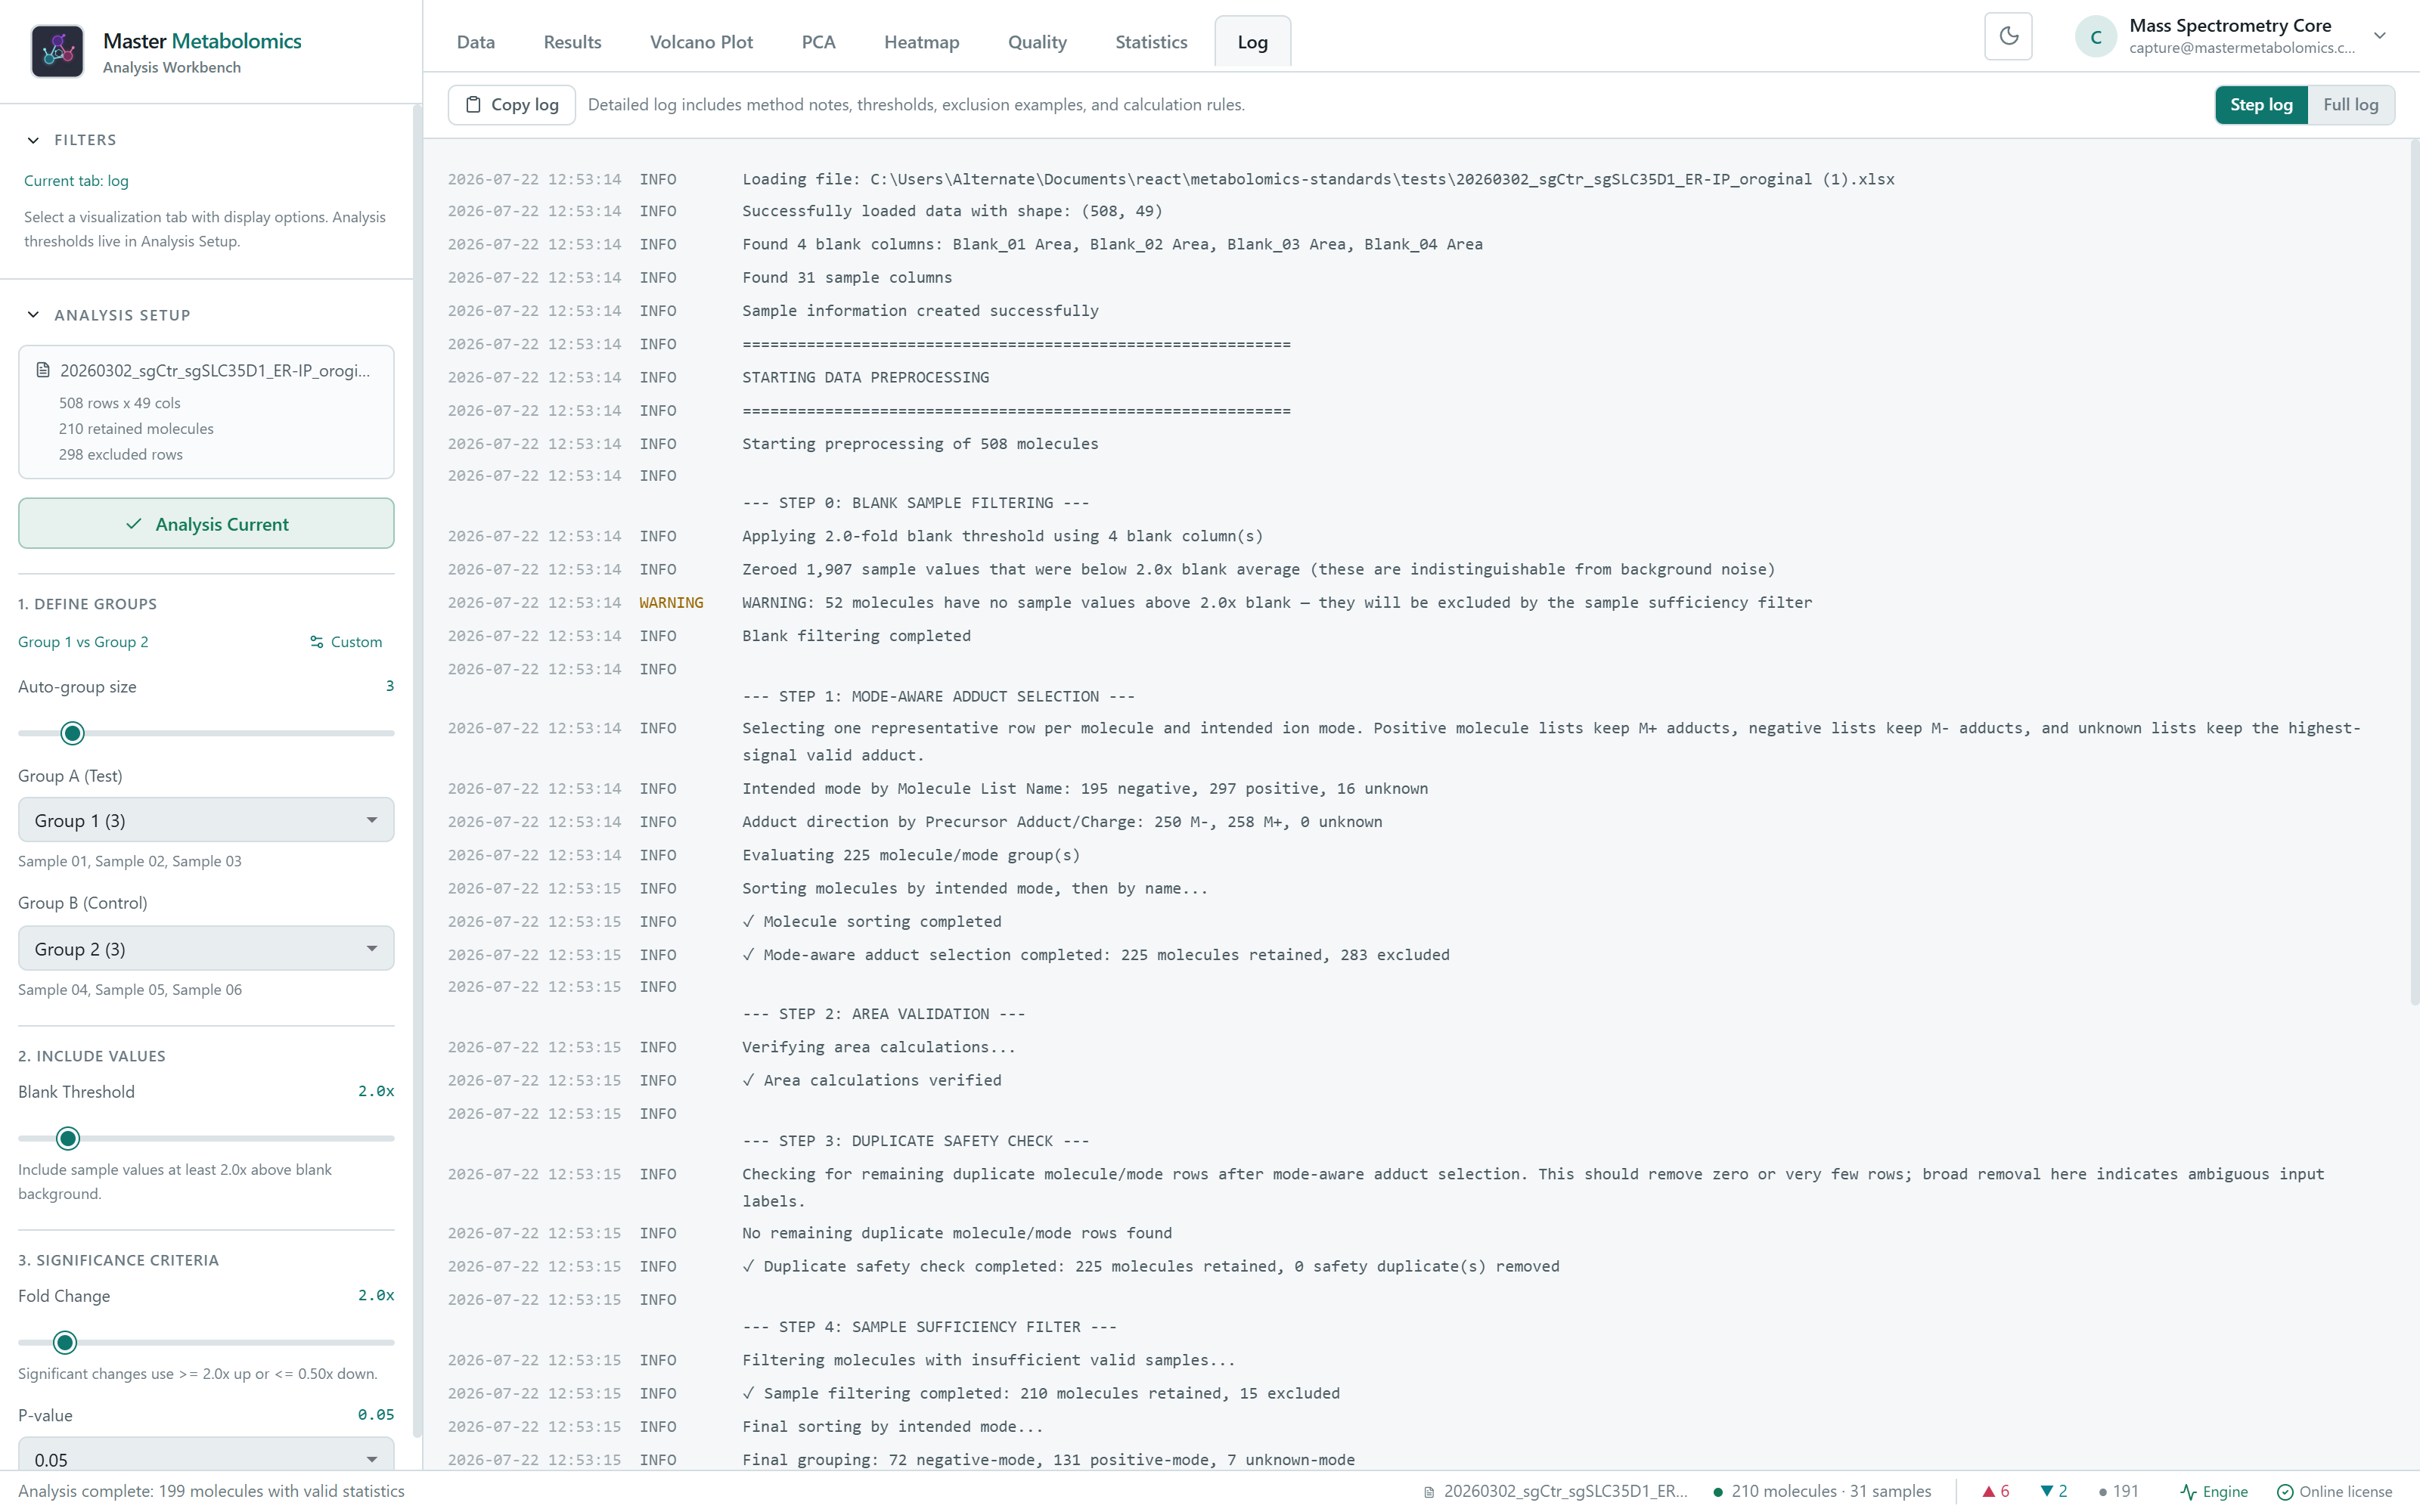
Analysis workflow
From workbook cleanup to export-ready results.
Each step of the analysis lives in one workbench, so you can move from
raw import to reviewed comparison without losing the context that
explains a result.
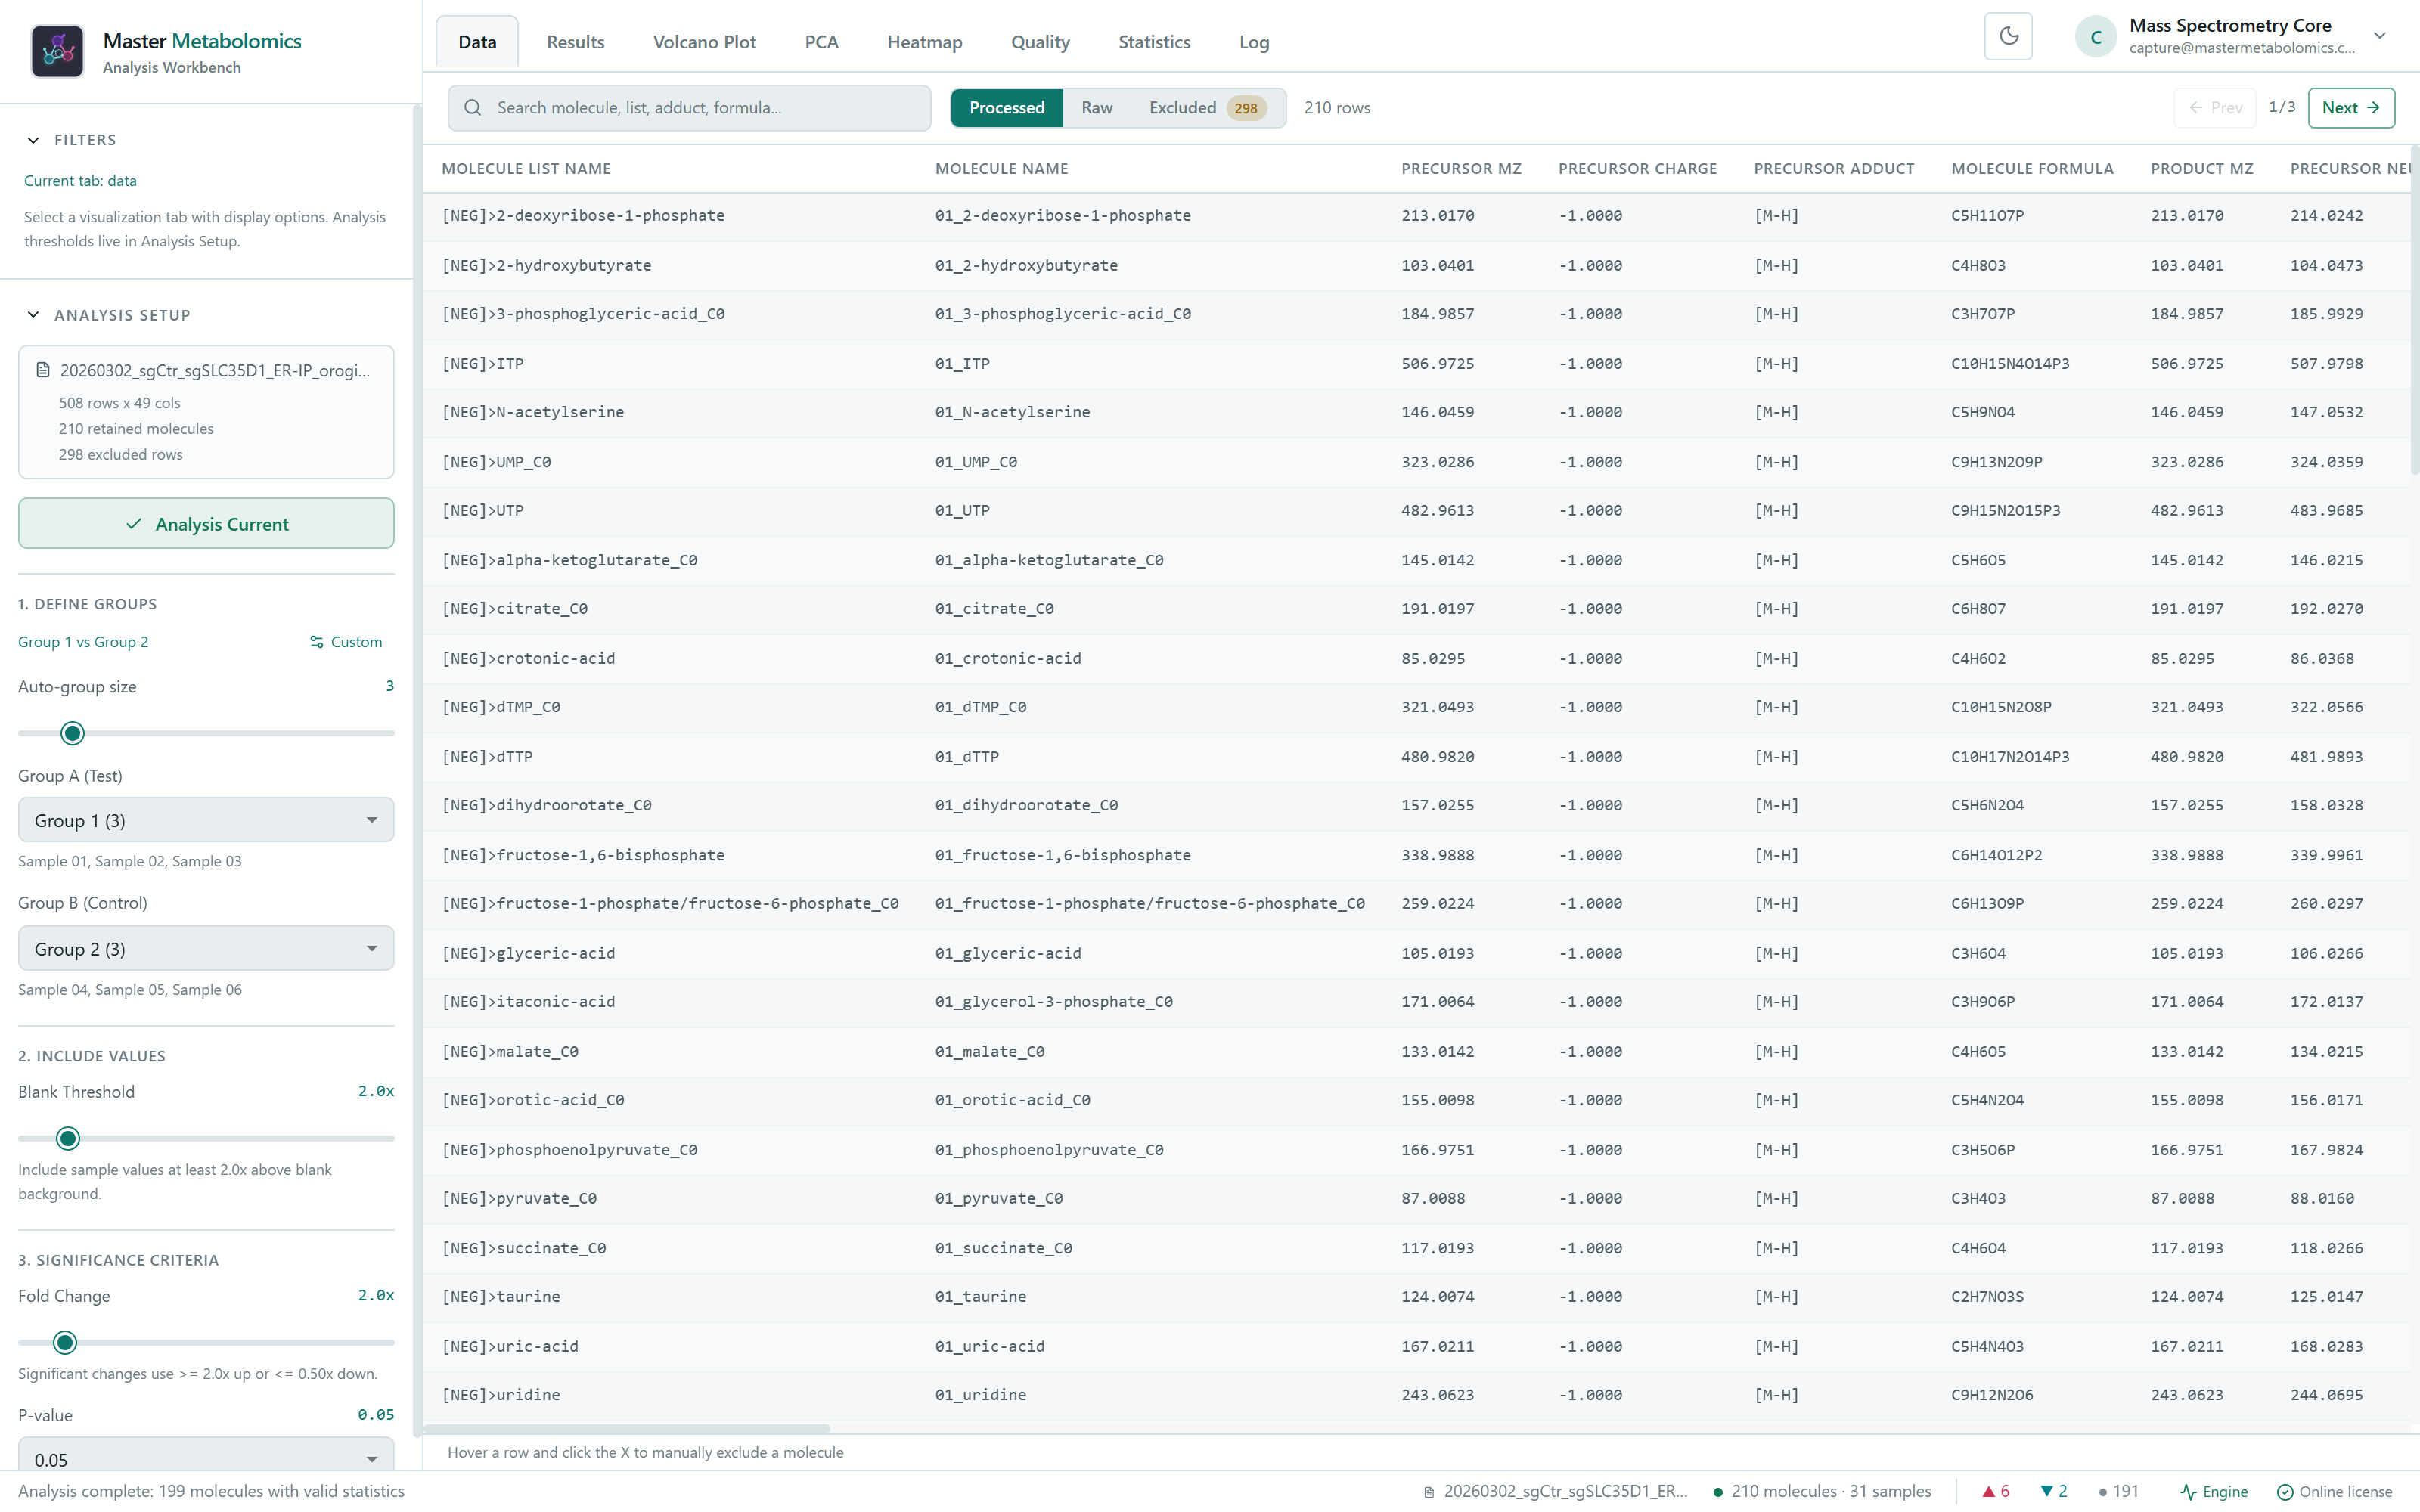
Load, filter, and define groups.
Keep the source workbook, retained-molecule count, blank threshold, and active group comparison visible while you prepare the analysis.
Skyline-style CSV and XLSX import
Automatic or manual sample groups
Fold-change and p-value controls
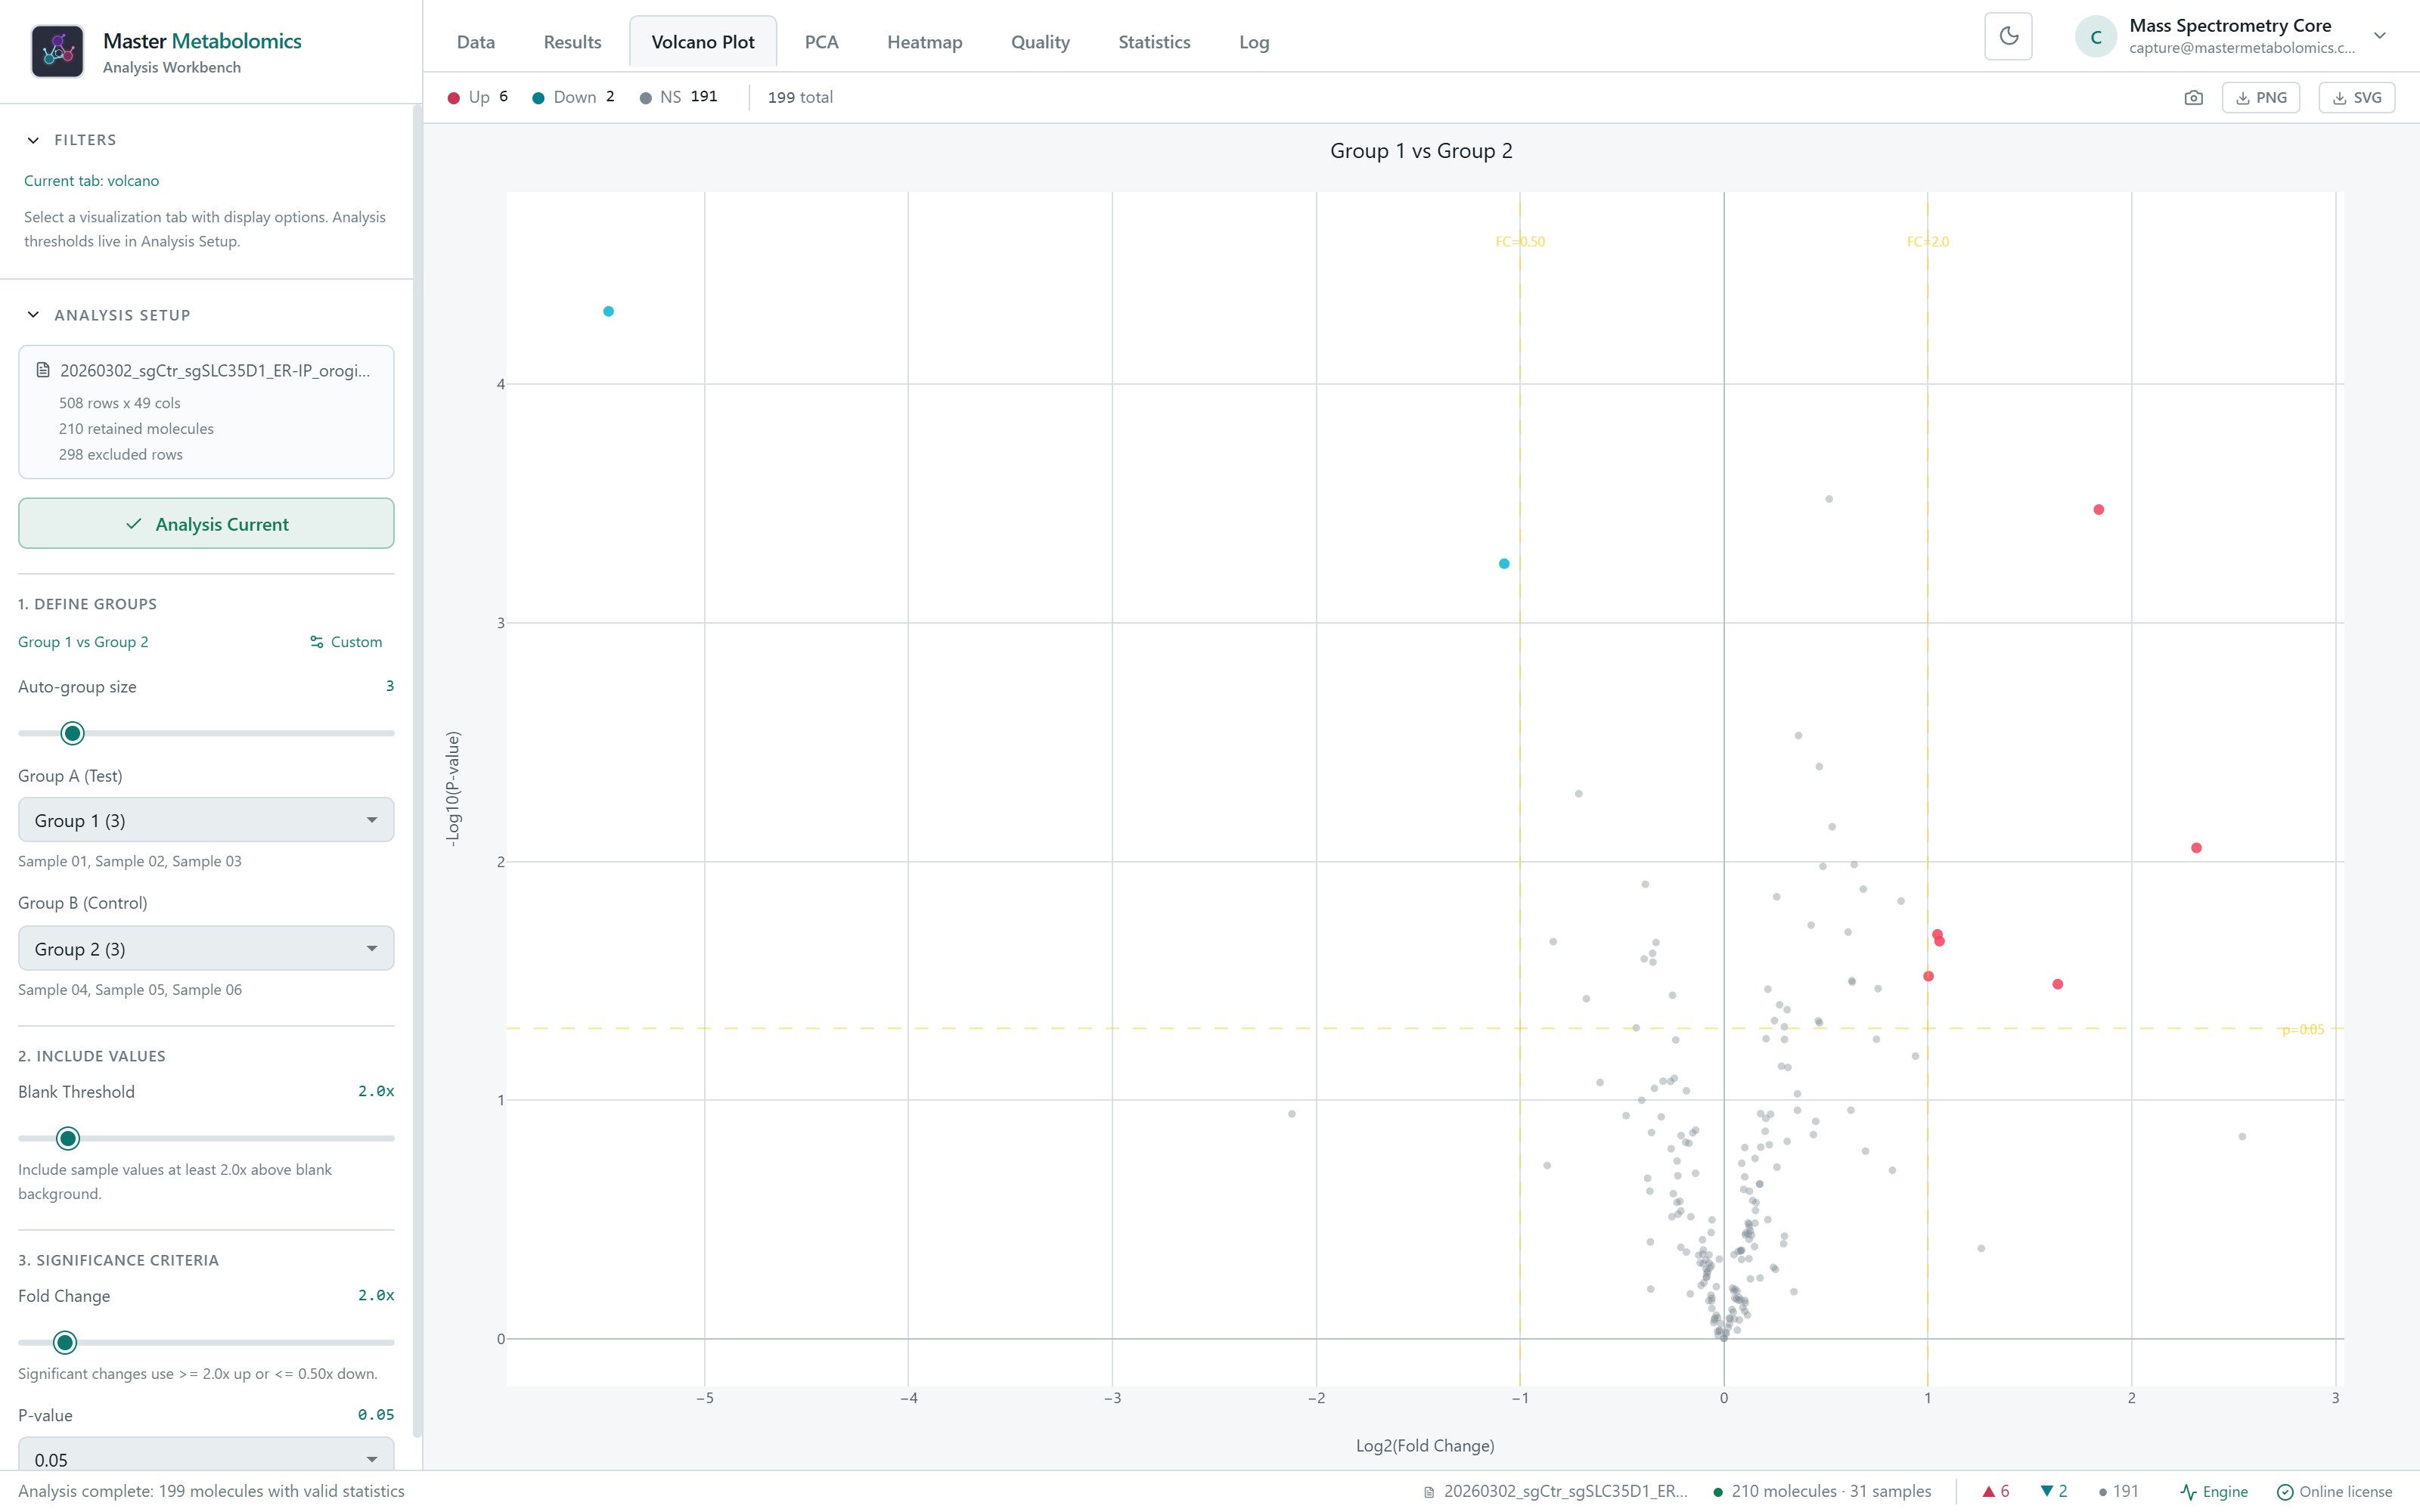
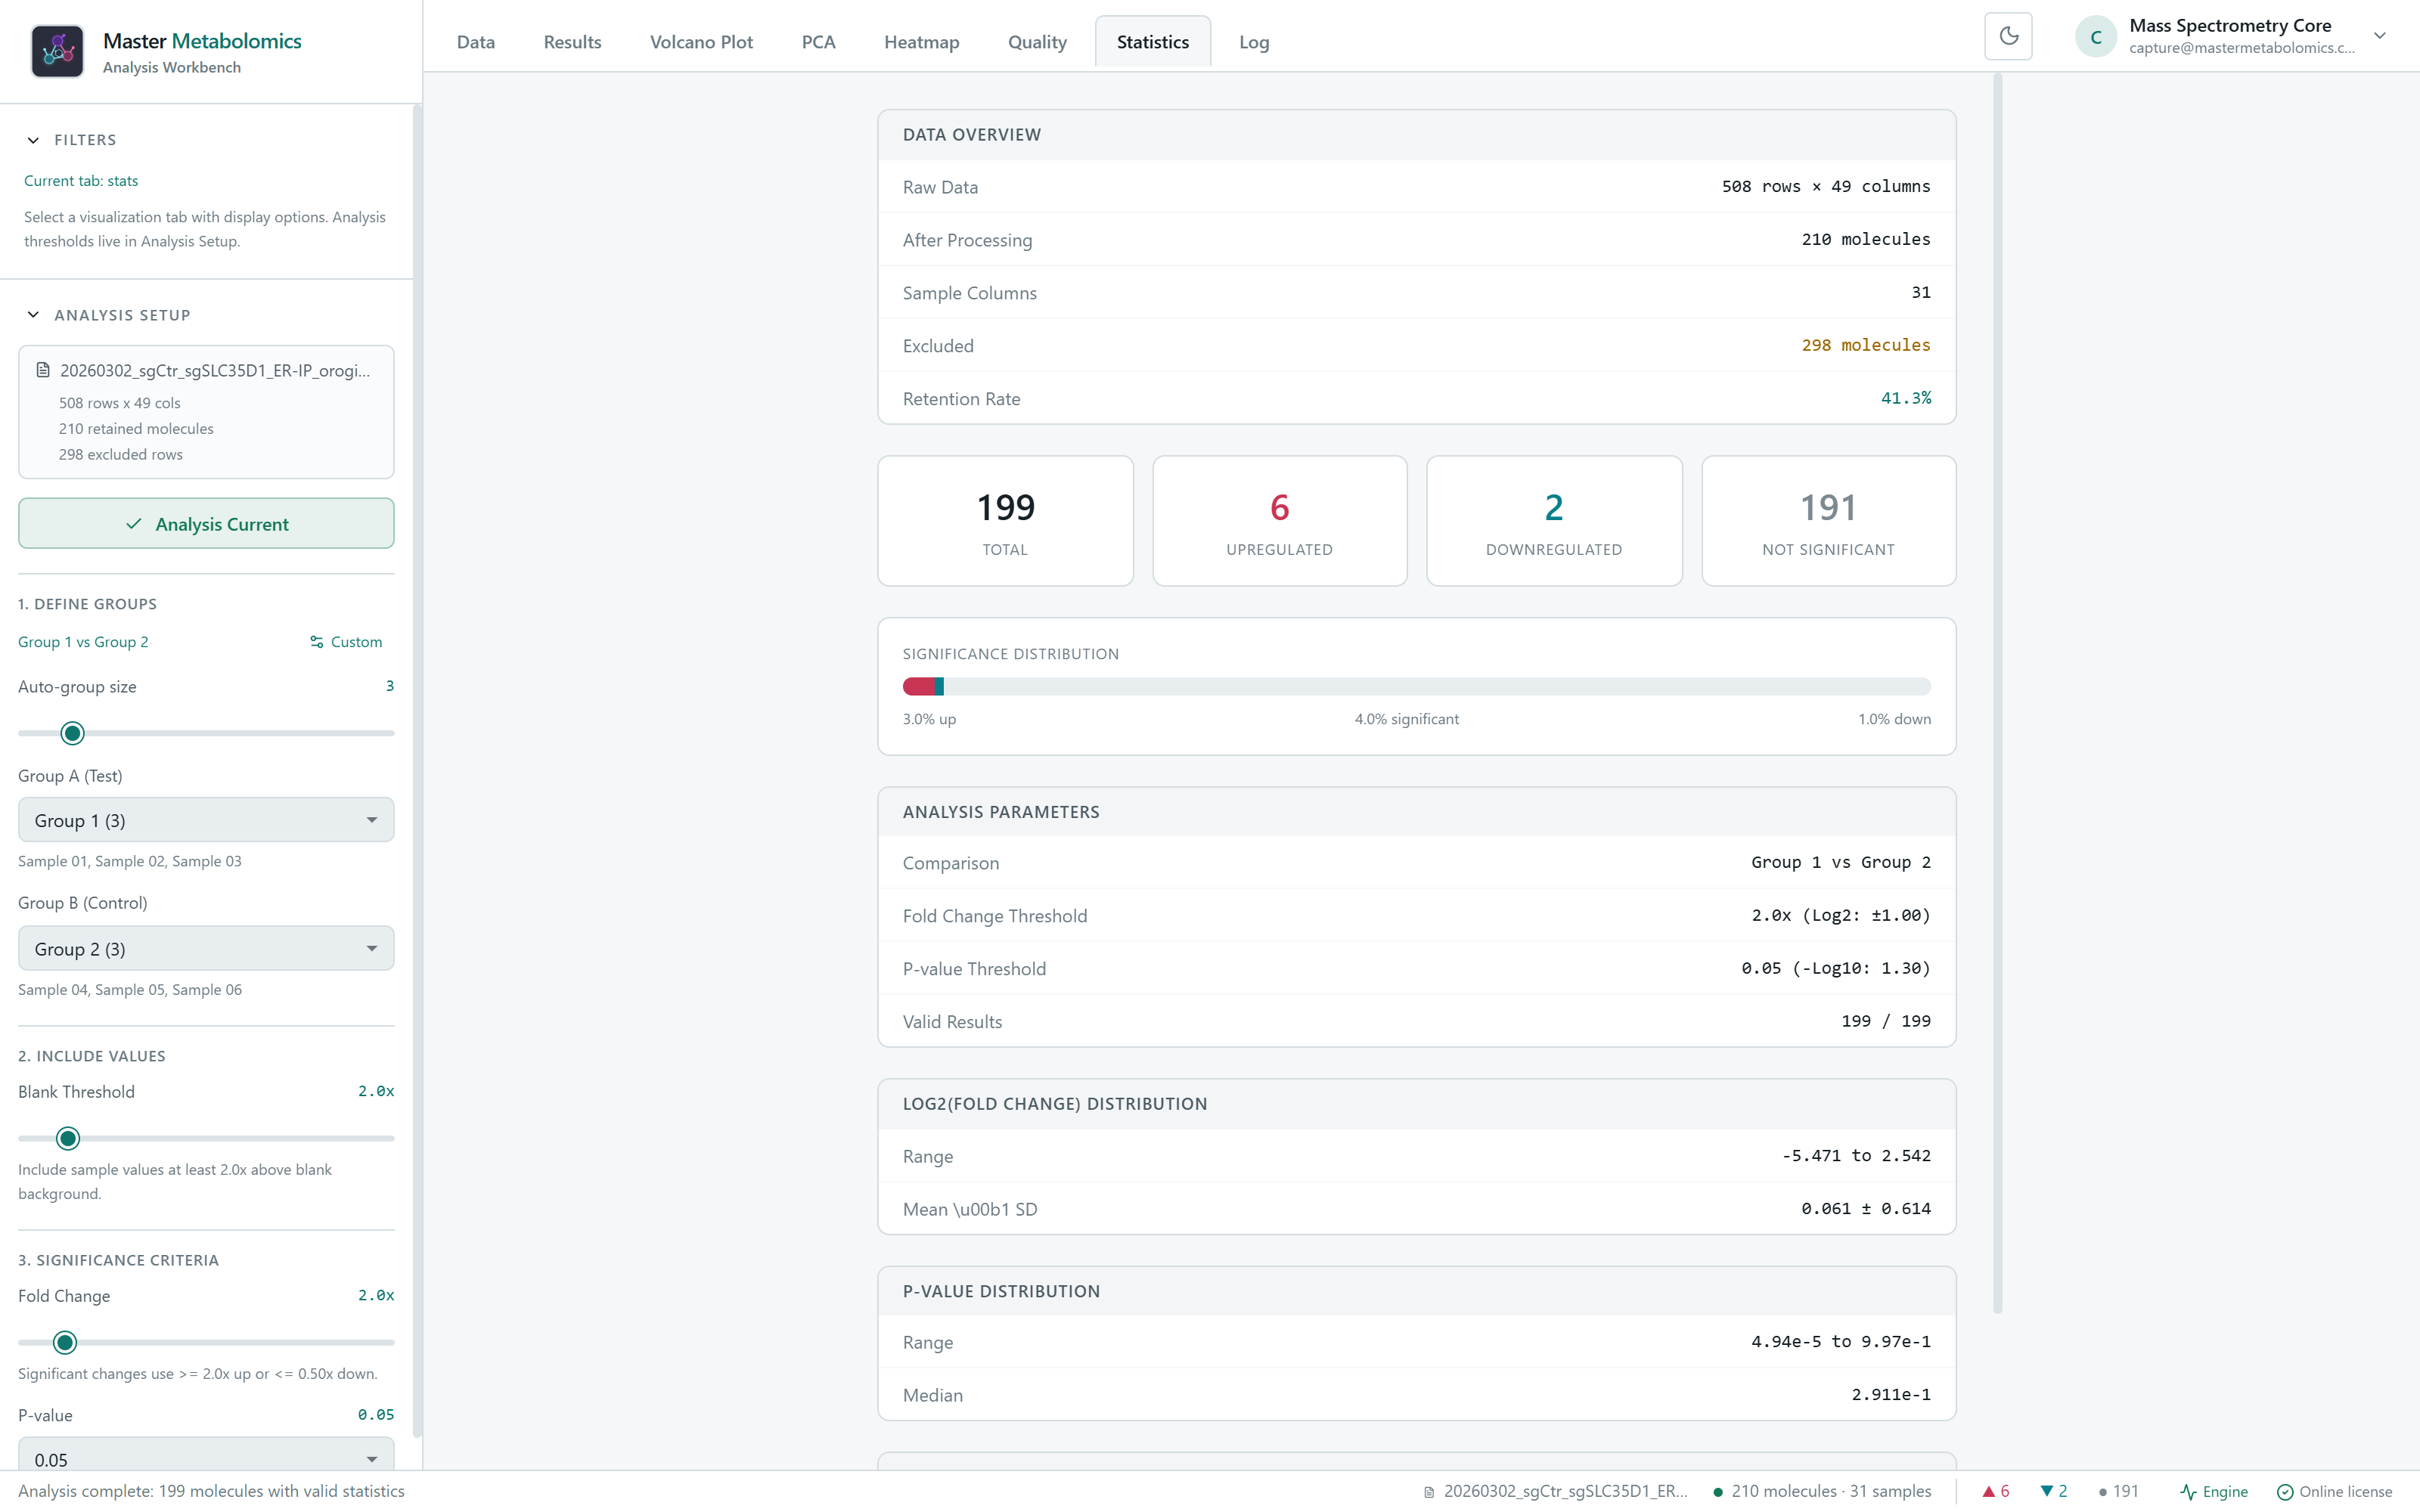
Move from thresholds to interpretable views.
The plot occupies the frame here because that is the evidence under review. Filters remain available without competing with the result.
Volcano plots with visible criteria
PCA and heatmap views from the same comparison
PNG, SVG, and result-table exports
Review outputs
Connected views for scientific interpretation.
Plots and tables are different views of the same processed workbook, so
a signal in the volcano plot maps straight to the molecule rows, rankings,
and exportable records behind it.
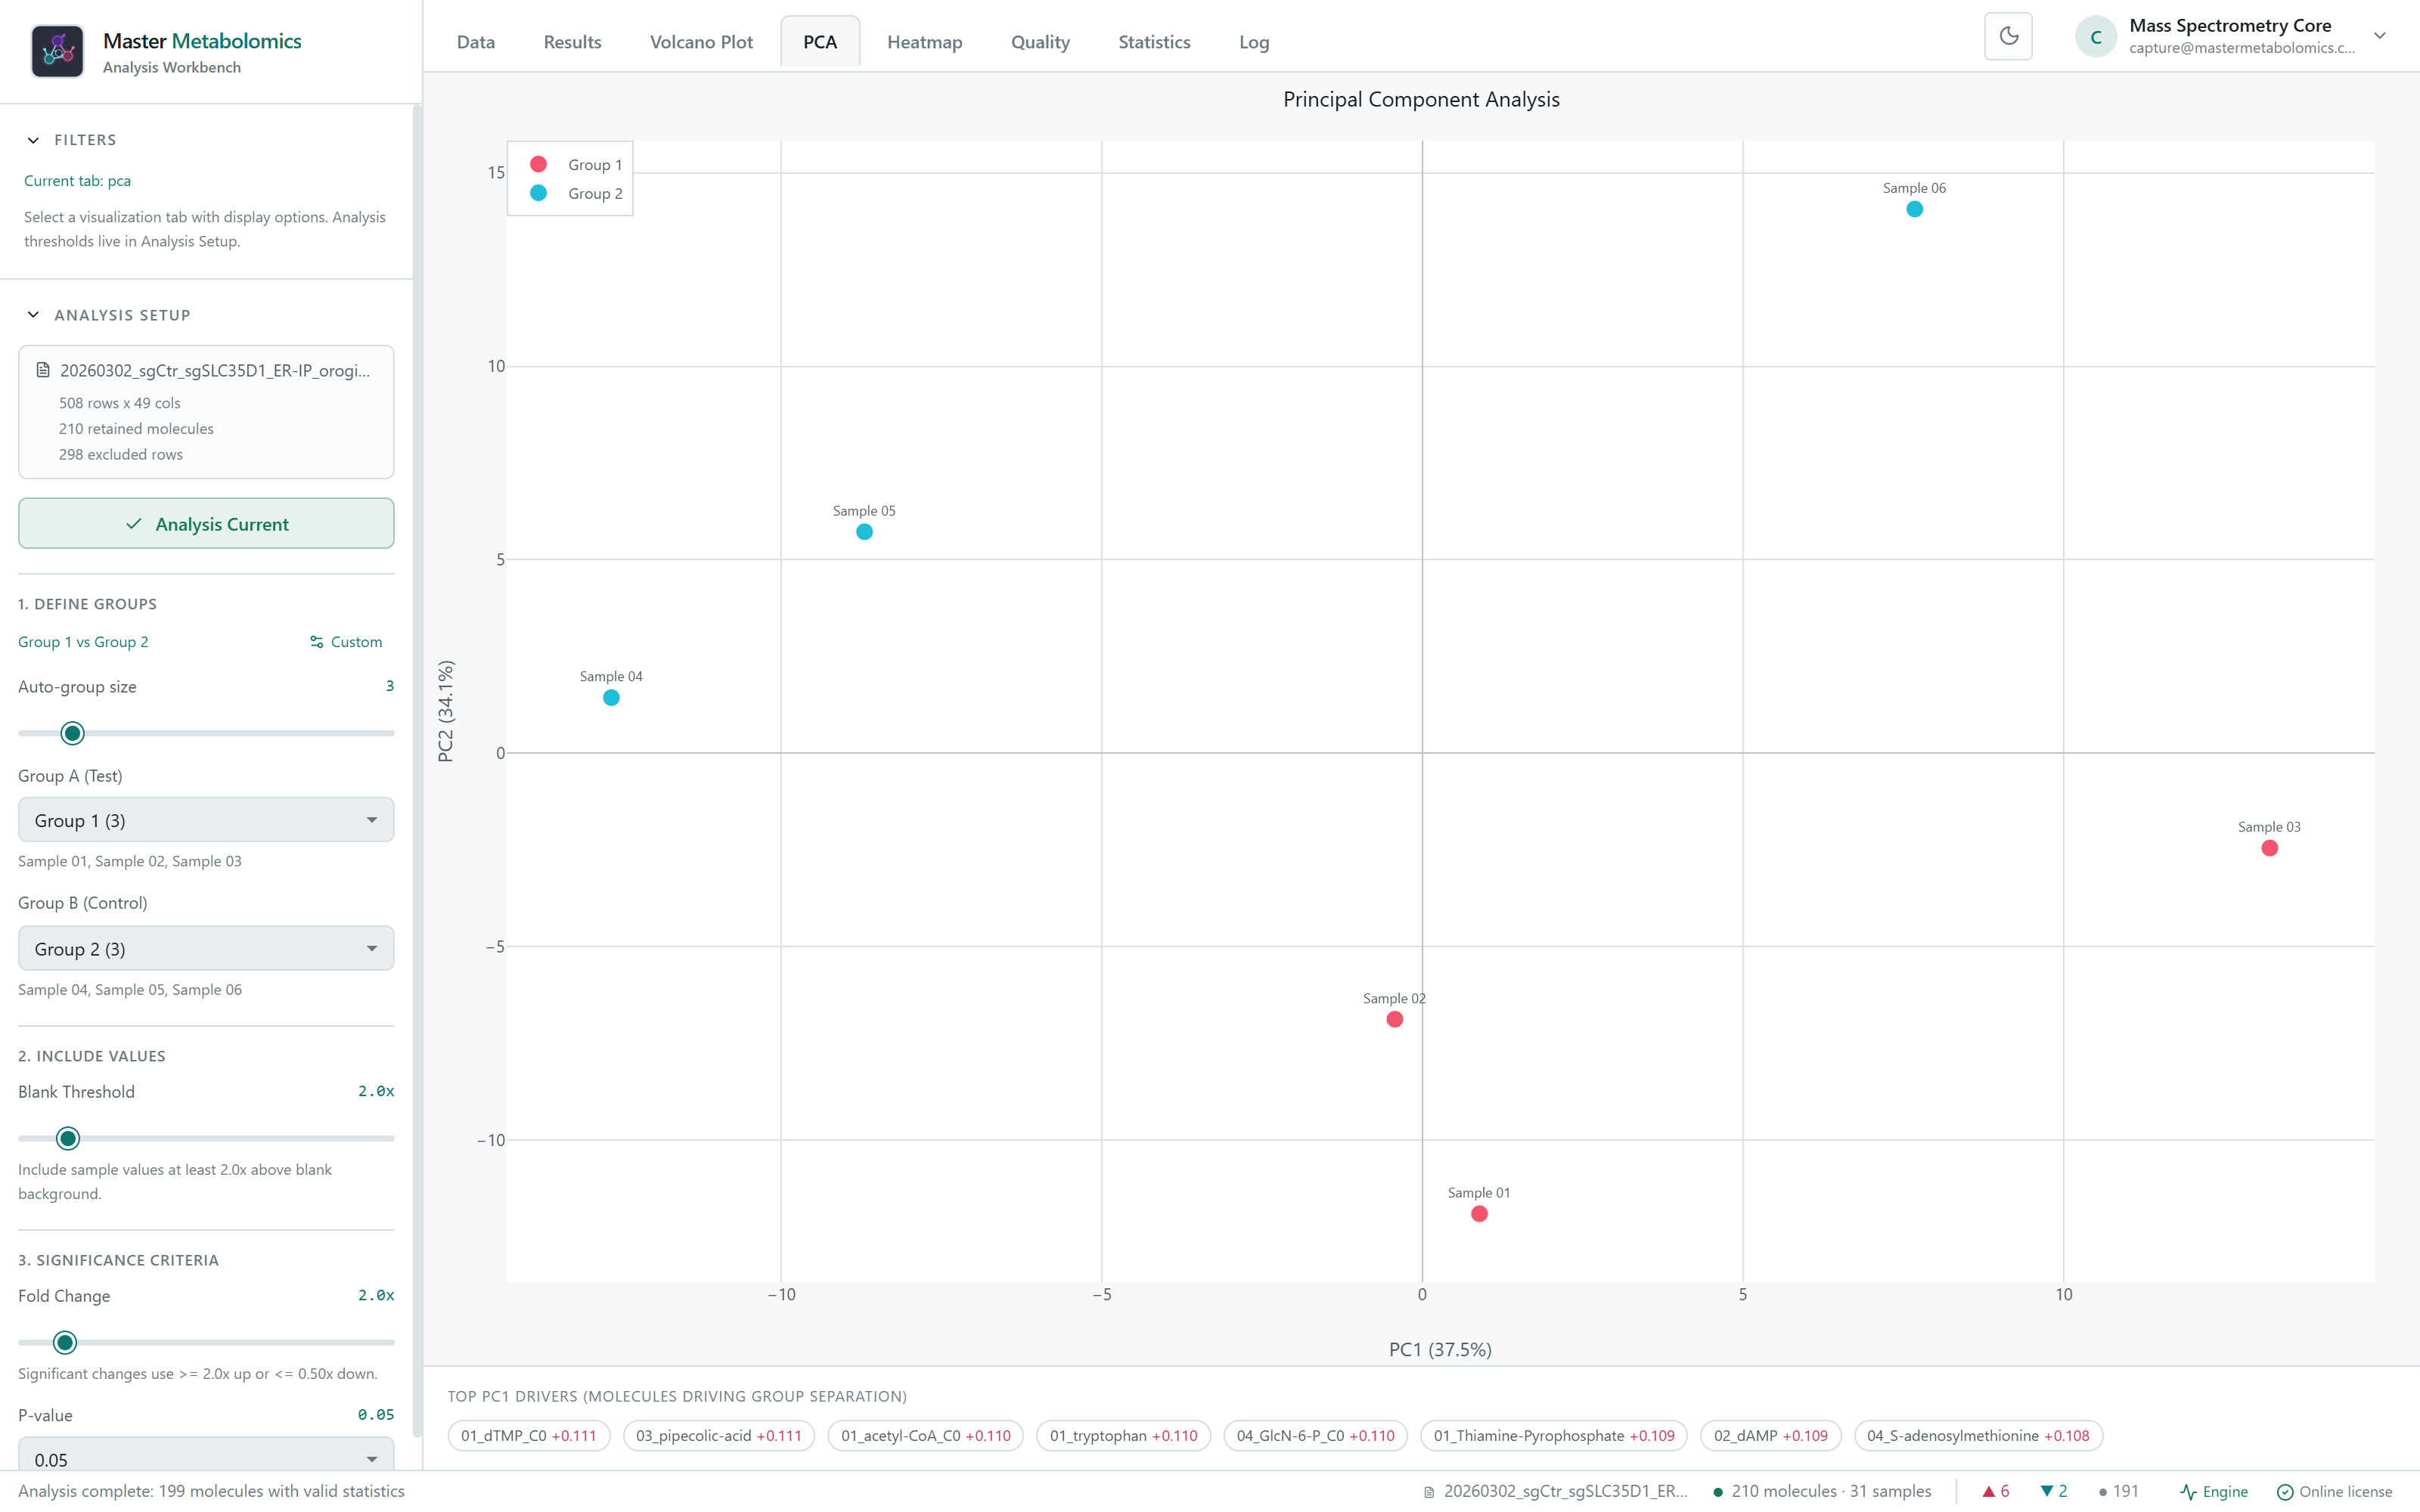
PCA sample clustering
Inspect sample separation and group structure from the active workbook comparison.
Group-colored sample scores
Variance explained on plotted principal components
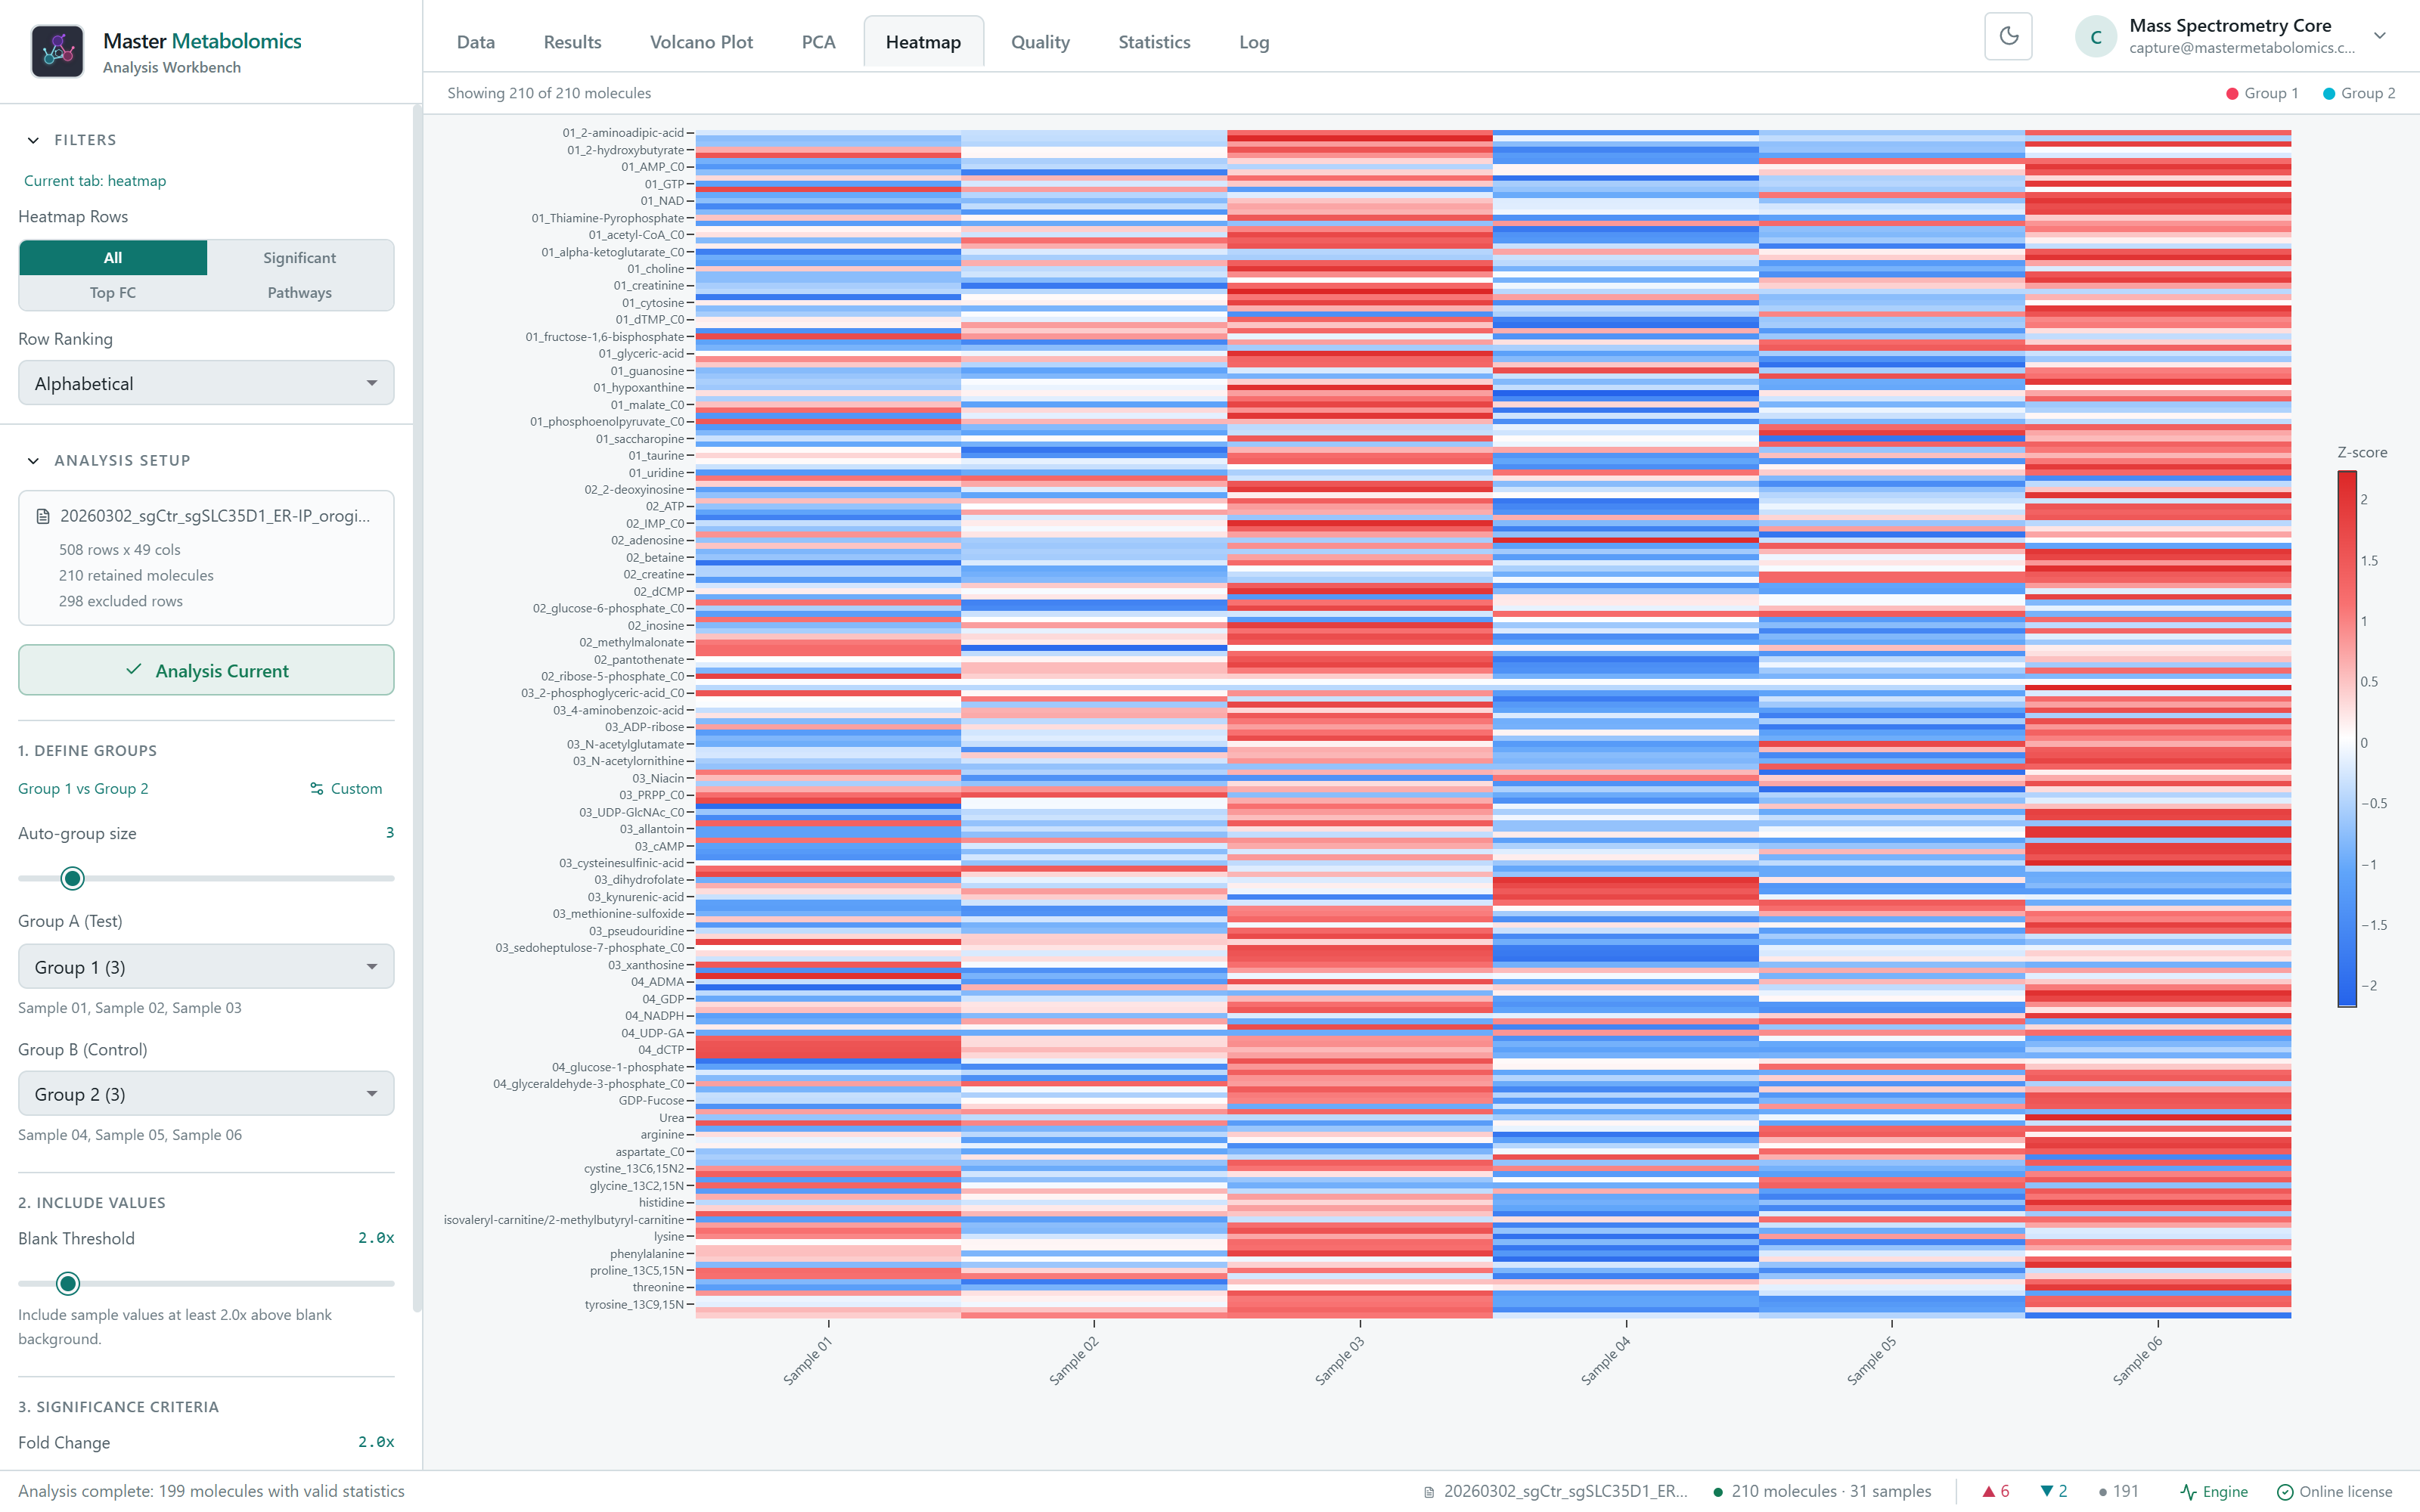
Heatmaps
Use z-score heatmaps to inspect group-level structure and sample-level variation.
Z-score matrix for relative abundance patterns
Sample and group labels kept in view
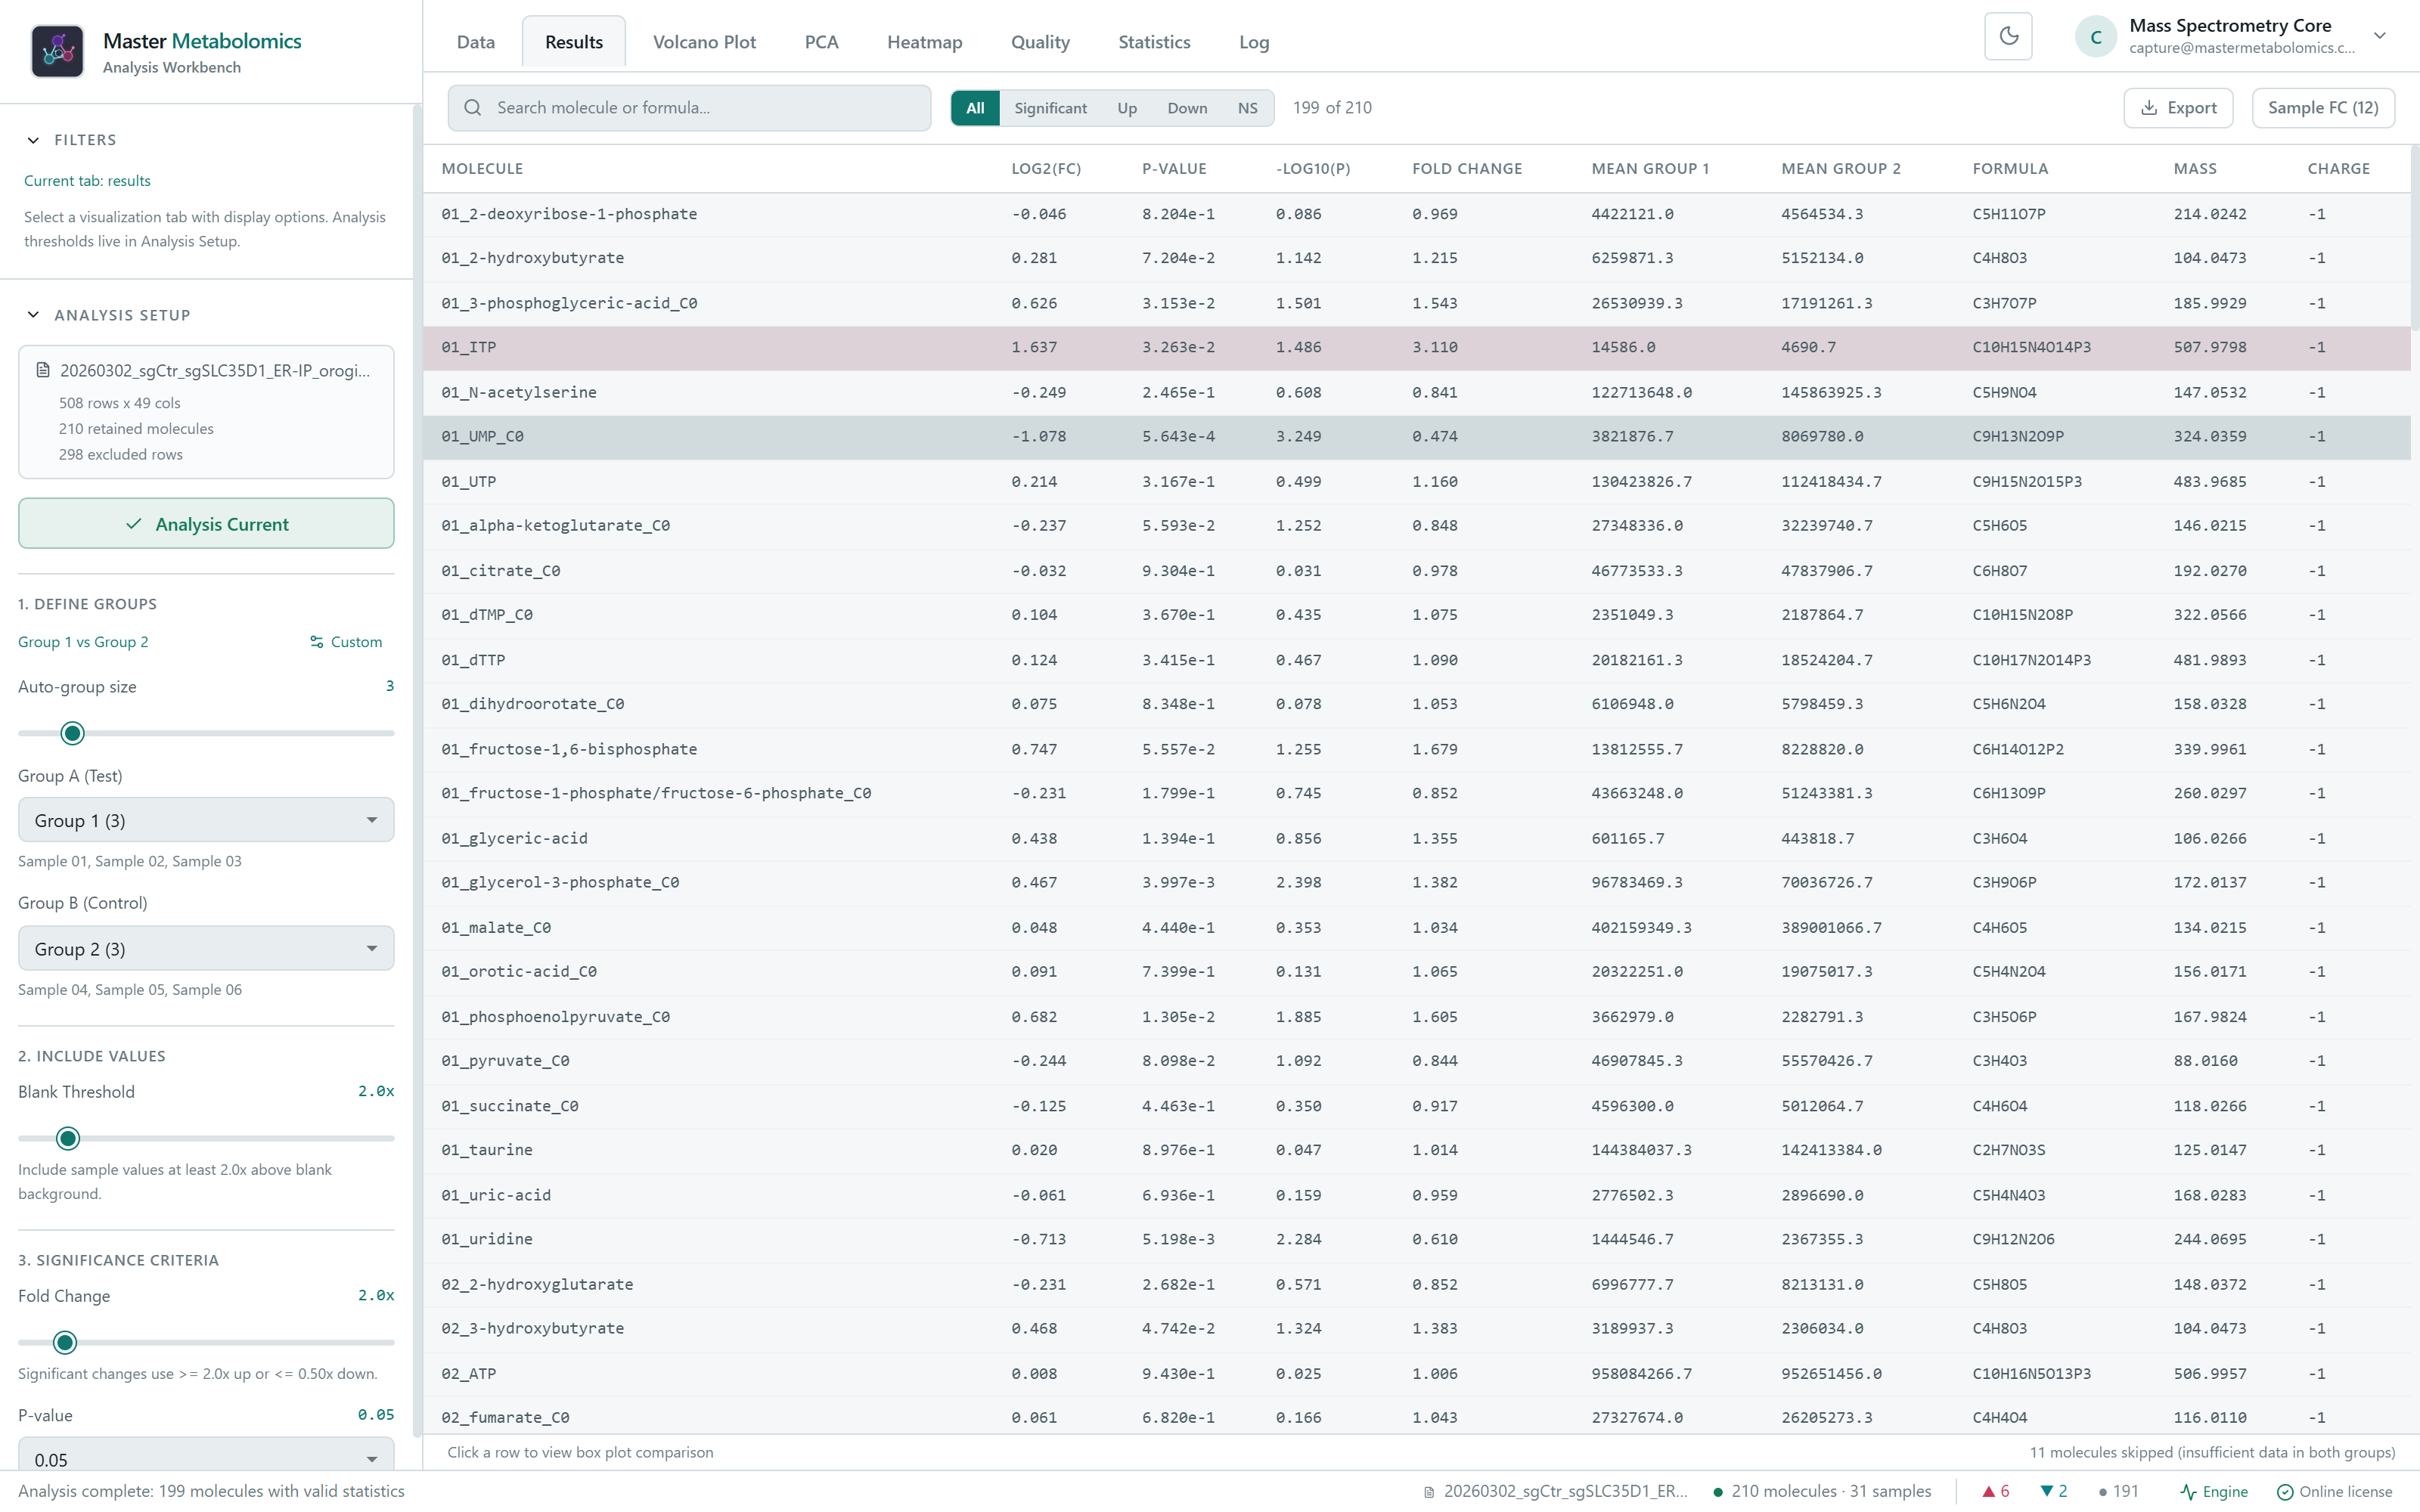
Searchable tables
Move from visual signals to molecule-level rows, fold-change rankings, and exportable records.
Search and sort molecule-level results
Export reviewed tables for downstream work
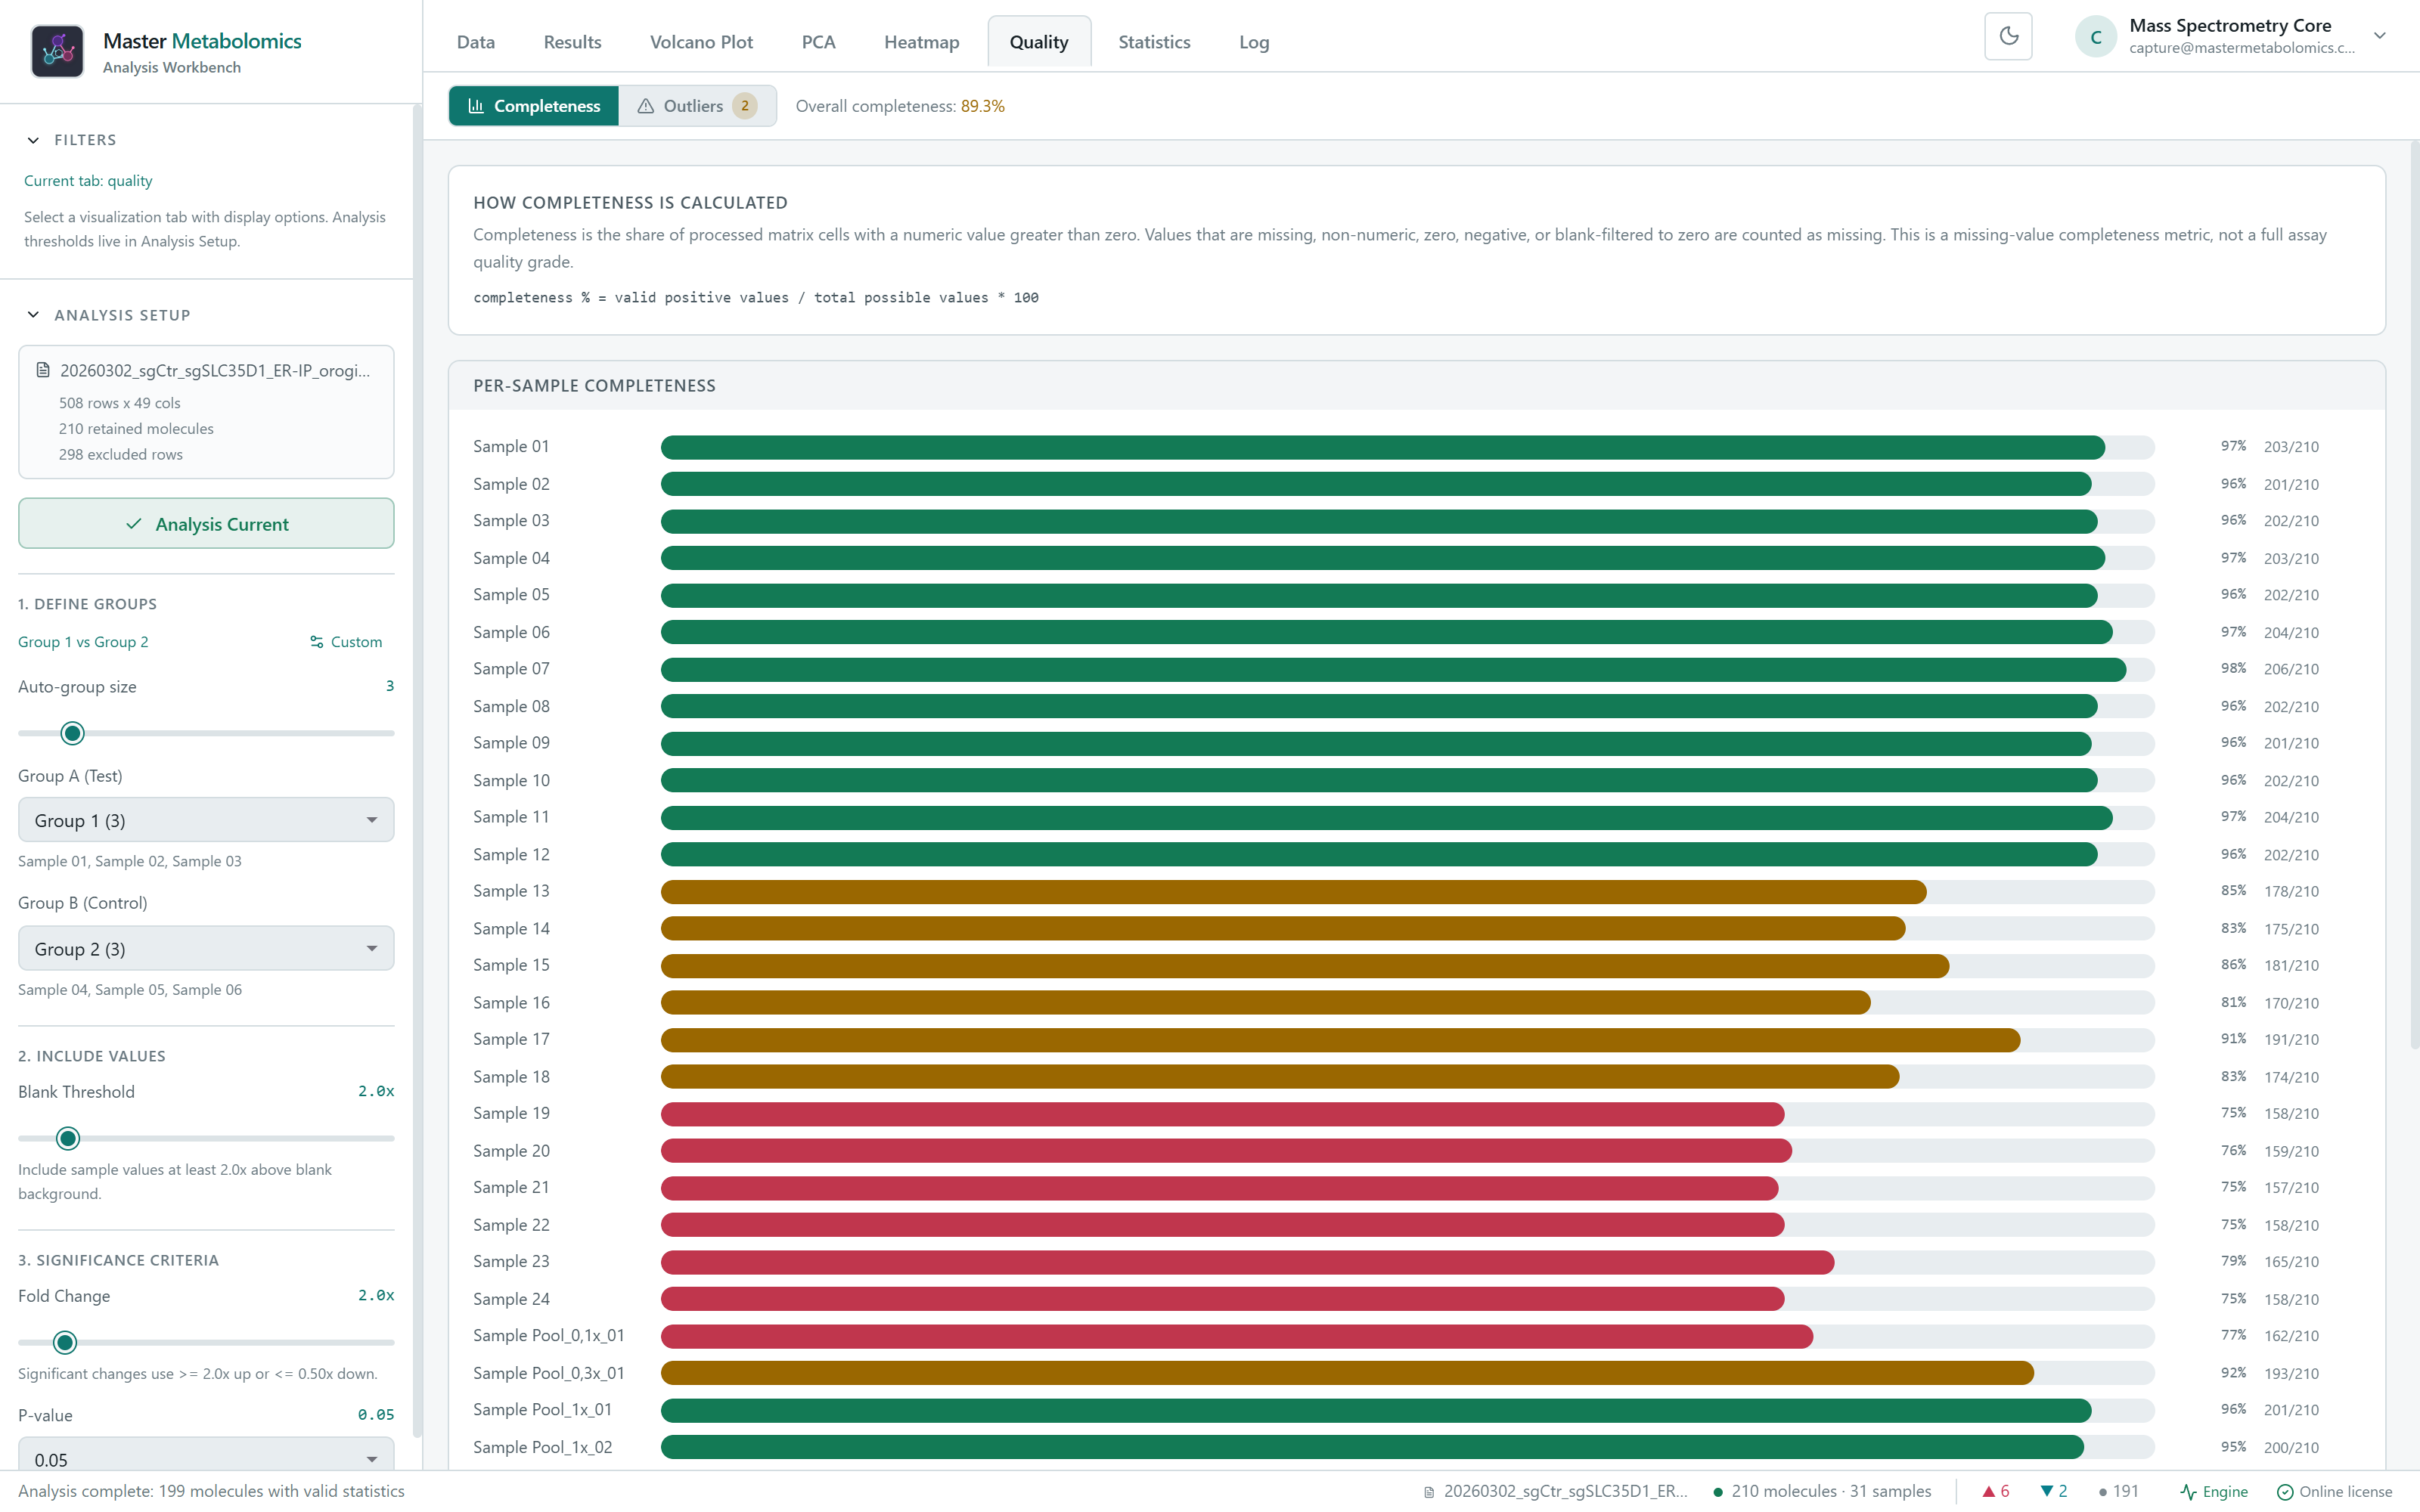
Quality review
Completeness and outlier checks
Review missing values, per-sample completeness, and outlier flags before interpreting group differences.