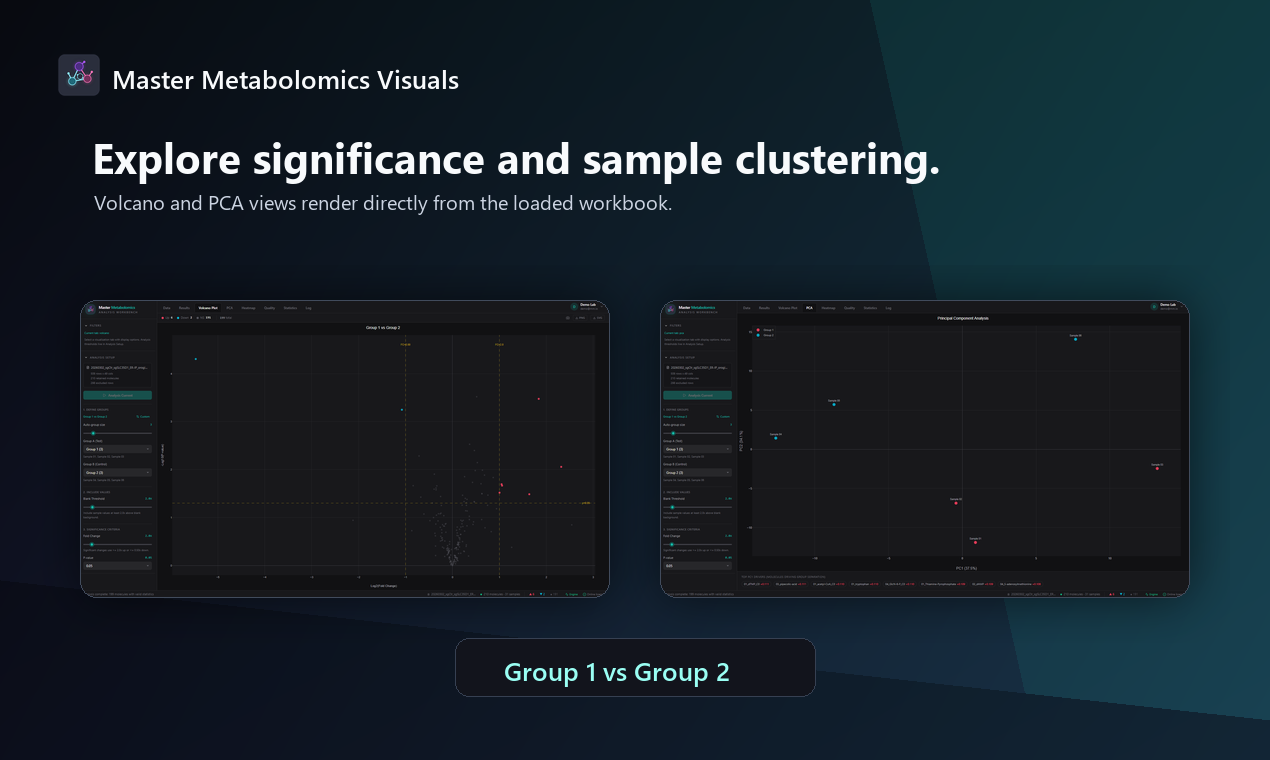
A single visualization rarely answers every metabolomics review question. Volcano plots help inspect significance and effect size, PCA helps inspect sample clustering, and heatmaps help surface broader expression patterns across samples.
Master Metabolomics keeps those views connected to the same loaded workbook and active comparison. The selected test and control groups, fold-change threshold, p-value threshold, and blank filtering choices define the result set shown across the app.
That connection is important. If a volcano plot and a result table are built from different intermediate files, the review becomes harder to defend. A shared desktop analysis state keeps the visual and tabular views aligned.
The heatmap view adds pattern discovery after the comparison. Scientists can inspect z-score style sample patterns, group-aware labels, and row modes while still staying inside the same workbench.
The result is a practical loop: set up the comparison, run analysis, inspect the volcano plot, check PCA and heatmaps, review the table, then export the result set and log.